Writing a stock-market application with Electron and Vue.js [Tutorial]
Have you ever wanted to quickly check your stocks? Firing up the browser, typing the URL to your preferred website and closing all the ads can take some time.
In this post, I'm going to showcase how to write your own, cross-platform, desktop application that will help you check your stocks using the Electron framework. As a bonus, you'll learn a bit of Vue.js in the process.
Where is the code?
The full code can also be found on Github: Fork
Estimated time: 40 minutes
End result
Before starting, you might want to see the end result. It's a desktop application composed of a few simple components:
- a search box with a Go button
- a summary of the stock
- a interactive chart describing the stock evolution
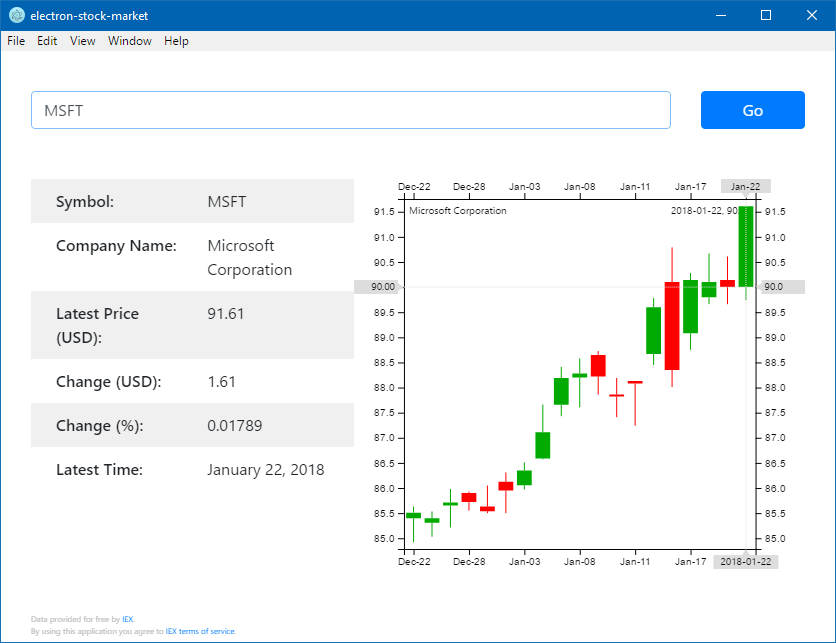
I know it looks like a lot of work, but it really isn't.
Prerequisites
Programming knowledge
You'll need medium JavaScript knowledge, some HTML & CSS knowledge. Being familiar with a framework such as Vue.js, Angular.js or even React.js will make things easier to understand.
As an editor, I personally recommend Visual Studio Code, but you can use any editor. Now let's get to it...
Node.js
We'll use node as a platform to run our electron application and npm (Node Package Manager) to manage dependencies)
Jump to this link and install the latest version (npm included).
package.json
Next, you're going to define the entry point and our dependencies.
Create a new file named package.json in an empty directory.
{
  "name": "electron-stock-market",
  "version": "1.0.0",
  "main": "./main",
  "private": true,
  "dependencies": {
    "electron": "^1.7.8",
    "vue": "^2.5.9",
    "vue-resource": "^1.3.4",
    "techan": "0.8.0",
    "d3": "4.12.0"
  },
  "devDependencies": {
    "browserify": "^14.5.0",
    "vueify": "^9.4.1"
  }
}
Installing dependencies
To install the dependencies defined above, just run npm install in your root folder. I'll explain later where each dependency is used.
Note: After the dependencies are installed, you'll need to wait 2-3 minutes for the post-scripts to be ran.
Writing the code
The main process
Now, you need to create the main file, also known as the main process. You may have noticed the main file was mentioned in the package.json. It tells node that this is the entry point of the electron app. We're making use of the electron dependency here.
- Create a new file named
main.js - Paste the default
main.jsfile (taken from the electron-quick-start repository). A small adjustment is needed for the the width and height of the window.
const electron = require('electron')
// Module to control application life.
const app = electron.app
// Module to create native browser window.
const BrowserWindow = electron.BrowserWindow

const path = require('path')
const url = require('url')

// Keep a global reference of the window object, if you don't, the window will
// be closed automatically when the JavaScript object is garbage collected.
let mainWindow

function createWindow() {
  // Create the browser window.
  mainWindow = new BrowserWindow({ width: 850, height: 650 })

  // and load the index.html of the app.
  mainWindow.loadURL(url.format({
    pathname: path.join(__dirname, 'index.html'),
    protocol: 'file:',
    slashes: true
  }))

  // Emitted when the window is closed.
  mainWindow.on('closed', function () {
    // Dereference the window object, usually you would store windows
    // in an array if your app supports multi windows, this is the time
    // when you should delete the corresponding element.
    mainWindow = null
  })

  mainWindow.webContents.on('new-window', function(event, url){
    event.preventDefault();
    electron.shell.openExternal(url);
  });
}

// This method will be called when Electron has finished
// initialization and is ready to create browser windows.
// Some APIs can only be used after this event occurs.
app.on('ready', createWindow)

// Quit when all windows are closed.
app.on('window-all-closed', function () {
  // On OS X it is common for applications and their menu bar
  // to stay active until the user quits explicitly with Cmd + Q
  if (process.platform !== 'darwin') {
    app.quit()
  }
})

app.on('activate', function () {
  // On OS X it's common to re-create a window in the app when the
  // dock icon is clicked and there are no other windows open.
  if (mainWindow === null) {
    createWindow()
  }
})
The HTML
Create a new file called index.html. In this file you'll include the script and write the entry-point tag of the application. I'm also including Bootstrap 4 beta, and the build (bundle file) at the end.
Since this is an electron application, there is no need to use <head> and <body> tags.
<link rel="stylesheet" href="https://maxcdn.bootstrapcdn.com/bootstrap/4.0.0-beta/css/bootstrap.min.css" type="text/css">

<div id="app"></div>
<script src="build/build.js"></script>
The Vue JS source
Create a new directory and call it src. Inside, create a new file and call it app.js. This is the entry point of the Vue JS instance. Here is the content:
//include Vue
var Vue = require('vue');

//instantiate Vue
new Vue({
    el: '#app'
});
In the above file, Vue JS is required, and a new instance is created specifying the root element.
We're using the vue dependency here.
Time to glue the pieces together
Create an empty directory called build at the root of your project. This will hold the build result.
Next, you'll need to add a build script to the package.json to be able to create the bundle.
Add a new scripts key as follows (make sure to add a comma before/after to preserve JSON validity):
"scripts": {
    "start": "./node_modules/.bin/electron .",
    "buildAndRun": "./node_modules/.bin/browserify -t vueify -e src/app.js -o build/build.js && npm start"
}
I just defined 2 scripts: start which will run the electron app, and buildAndRun which, you guessed right, will build and then run the electron app.
To run any of these, just type npm run-script <script_name>. For example, to build and run the app, you'll say:
npm run-script buildAndRunWhen running these scripts we're using the vueify and browserify dependencies.
If you ran the above script you'll see a blank electron window. Let's add some content.
My first component
Time to build your first component...
In a new directory called components (inside src), create a new file and call it home.vue.
Note: Vue JS allows multiple programming styles. In this tutorial, I'm going to follow the official guidelines and go with the approach where html, scripting and styling are combined into a vue component file. Basically, you'll find everything you need for that component in the component file.
Note 2: If you're using Visual Studio Code, I recommend installing the Vetur extension now. It helps with the syntax highlighting and linting.
Copy and paste the following code snippets in your newly created file (home.vue):
Start with the template
<template>
    <div class="container-fluid margins">
        <div class="row">
            <div class="col-10">
                <input type="text" class="form-control full-width"
                       autofocus placeholder="Enter symbol..." v-model="symbol" v-on:keyup.enter="search"/>
            </div>
            <div class="col-2">
                <input type="button" class="btn btn-primary full-width" value="Go" v-on:click="search" />
            </div>
        </div>

       <stock-quote v-bind:stock="stock"></stock-quote>
       <div class="alert alert-danger" role="alert" v-if="error">
         <strong>Error!</strong> {{this.error}}
       </div>

       <p class="small bottom">Data provided for free by
        <a href="https://iextrading.com/developer" target="_blank">IEX</a>.
        <br/> By using this application you agree to
        <a href="https://iextrading.com/api-exhibit-a" target="_blank">IEX terms of service</a>.
       </p>

    </div>
</template>
This might seem overwhelming at first, but it shouldn't be. You're defining a text input, bound to the symbol v-model. This input will trigger the search function when the Enter key is pressed.
Next, a Go button is needed, which triggers the same search function on click.
After we have the input, it's time to display the data. We're separating the stock content into a separate component so you can see how the components connect and communicate with each other. I'm calling this component stock-quote.
I included an error div, which is shown only when an issue shows up with the data request.
At the end, you need to include the links to the data provider IEX, which, by the way, are kind enough to give access to this data for free.
Back to our home.vue component:
The script is where the magic happens
<script>
//include the quote component
var Quote = require("./quote.vue");

//export the needed properties
module.exports = {
  //the data model (props)
  data() {
    return {
      stock: {},
      error: ""
    };
  },
  //declare the included components, used in html
  components: {
    "stock-quote": Quote
  },
  methods: {
    //init method, initialize props
    init() {
      this.stock = {};
      this.error = "";
    },
    //search method, calls API
    search() {
      let url = `https://api.iextrading.com/1.0/stock/${this.symbol}/quote`;

      this.init();
      this.$http
        .get(url)
        .then(result => {
          this.stock = result.data;
        })
        .catch(this.handleErrors);
    },
    //method to handle errors
    handleErrors(err) {
      if (err.status === 404) {
        this.error = "The specified symbol could not be found...";
      } else {
        this.error = "There was an error retrieving the data...";
      }
    }
  }
};
</script>
Everything you want to use in your Vue JS application needs to be exported. So we'll start with the props, which are also used in the template: stock and error.
You'll need to declare the child components using the components key. The key is the HTML notation, and the value is the imported component.
The methods are pretty straight forward:
- The init will reset the props (for a new search)
- The search will call the public API with the value from the search box model
this.symboland save the data into thestockprop. - In case of an error, you'll set the message in the
errorprop, taking into account the 404 error (when the user types an non-existent stock symbol).
A little touch of style
<style>
.margins {
  padding: 40px 30px;
}
.full-width {
  width: 100%;
}
.small {
  font-size: 8px;
  color: #c0c0c0;
}
.bottom {
  position: absolute;
  bottom: 5px;
  margin: 0 auto;
}
</style>
End result
Your home component should now look like this:
<template>
    ...
</template>
<script>
    ...
</script>
<style>
    ...
</style>
Bindings
You'll need to load the newly created Home component into the Vue instance back in app.js. Your file should now read:
//include Vue and home component
var Vue = require('vue');
var Home = require('./components/home.vue');
var VueResource = require('vue-resource');

Vue.use(VueResource);

//instantiate Vue
new Vue({
    el: '#app',
    //render function is used to render the component
    render: function (createElement) {
        return createElement(Home);
    }
});
You required the Home component and used it in the render function.
You also need VueResource for the http requests functionality. We're using the vue-resource dependency here.
Another component
It's time for another component: The stock-quote component you previously included in your home component.
As usual, create a new file inside the components directory and call it quote.vue. The structure is the same as the home component: template, script, style.
The template:
<template>
    <div class="container-fluid">
        <div class="row">
            <div class="col-5">
                <div class="quote" v-if="stock.symbol">
                    <div class="row">
                        <div class="col-6">Symbol:</div>
                        <div class="col-6">{{stock.symbol}}</div>
                    </div>
                    <div class="row">
                        <div class="col-6">Company Name:</div>
                        <div class="col-6">{{stock.companyName}}</div>
                    </div>
                    <div class="row">
                        <div class="col-6">Latest Price (USD):</div>
                        <div class="col-6">{{stock.latestPrice}}</div>
                    </div>
                    <div class="row">
                        <div class="col-6">Change (USD):</div>
                        <div class="col-6">{{stock.change}}</div>
                    </div>
                    <div class="row">
                        <div class="col-6">Change (%):</div>
                        <div class="col-6">{{stock.changePercent}}</div>
                    </div>
                    <div class="row">
                        <div class="col-6">Latest Time:</div>
                        <div class="col-6">{{stock.latestTime}}</div>
                    </div>
                </div>
            </div>
            <div class="col-7">
                <div class="graph row" id="graph"></div>
            </div>
        </div>
    </div>
</template>
A simple table with two columns, where the first column shows the label, and the second column shows the value. I included a placeholder for the graph, which we'll add later.
The script:
<script>
module.exports = {
  props: ["stock"]
};
</script>
The style:
<style>
.quote {
  margin-top: 50px;
}

.quote .row {
  padding: 10px;
}

.quote .row div:first-child {
  font-weight: 500;
}

.quote .row:nth-child(odd) {
  background-color: #f0f0f0;
}
</style>
A first attempt
Now it's time to see some code coming to life.
Just run this command:
npm run-script buildAndRunIf you're using VS Code, you'll also be able to access the tasks using the Tasks menu (Ctrl + Shift + B).
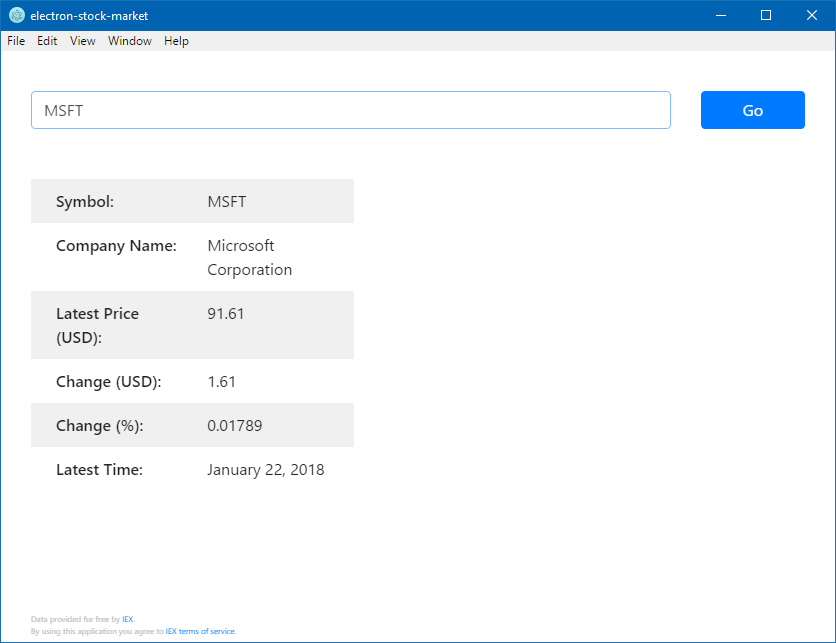
It should look like this:
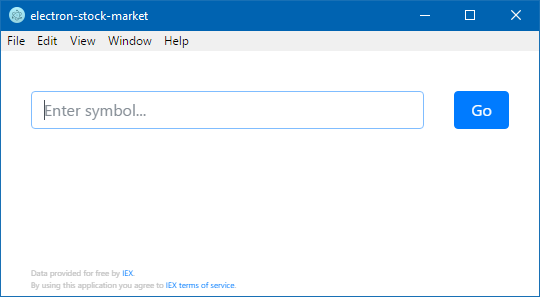
Now enter a stock symbol, for instance MSFT (for Microsoft) and click search or tap Enter to see the result:
Adding the chart
Time to use the other two dependencies: d3 and techan. We'll be using techan for technical analysis charts, and d3 as a base charting library.
I took one of the examples on Github and built on top of it to make it suitable for this app.
Create a new folder, call it lib and a new file g-crosshair.js. Here's the content:
//include d3 and techan
global.d3 = require('d3');
let techan = require('../node_modules/techan/dist/techan.min');

//predefined dimensions for the chart
const dimensions = {
    top: 20,
    bottom: 30,
    right: 50,
    left: 50,
    height: 400,
    labelSize: 40
};

//main draw function, receives data, company name, width, default coordinates
let drawGraph = function (graphData, companyName, customWidth, goToX, goToY) {
    //initialize width, height and number of ticks
    var width = customWidth - dimensions.left - dimensions.right,
        height = dimensions.height - dimensions.top - dimensions.bottom,
        ticks = Math.round(width / dimensions.labelSize),
        optimalTicks = Math.ceil(graphData.length / ticks);

    //parse date function
    var parseDate = d3.timeParse("%Y-%m-%d");

    //initialize x axis
    var x = techan.scale.financetime().range([0, width]);

    //initialize y axis
    var y = d3.scaleLinear().range([height, 0]);

    //build the candlestick chart
    var candlestick = techan.plot
        .candlestick()
        .xScale(x)
        .yScale(y);

    //determine which ticks will be visible based on width
    var visibleTicks = graphData.map(el => parseDate(el.date))
        .filter((el, idx) => {
            if (idx % optimalTicks === 0) {
                return el;
            }
        });

    //build x bottom axis
    var xAxis = d3.axisBottom(x)
        .tickValues(visibleTicks)
        .tickFormat(d3.timeFormat("%b-%d"));

    //build x top axis
    var xTopAxis = d3.axisTop(x)
        .tickValues(visibleTicks)
        .tickFormat(d3.timeFormat("%b-%d"));

    //build y left axis
    var yAxis = d3.axisLeft(y);

    //build y right axis
    var yRightAxis = d3.axisRight(y);

    //annotation left
    var ohlcAnnotation = techan.plot
        .axisannotation()
        .axis(yAxis)
        .orient("left")
        .format(d3.format(",.2f"));

    //annotation right
    var ohlcRightAnnotation = techan.plot
        .axisannotation()
        .axis(yRightAxis)
        .orient("right")
        .translate([width, 0]);

    //time annotation bottom
    var timeAnnotation = techan.plot
        .axisannotation()
        .axis(xAxis)
        .orient("bottom")
        .format(d3.timeFormat("%Y-%m-%d"))
        .width(65)
        .translate([0, height]);

    //time annotation top
    var timeTopAnnotation = techan.plot
        .axisannotation()
        .axis(xTopAxis)
        .orient("top");

    //plot crosshair
    var crosshair = techan.plot
        .crosshair()
        .xScale(x)
        .yScale(y)
        .xAnnotation([timeAnnotation, timeTopAnnotation])
        .yAnnotation([ohlcAnnotation, ohlcRightAnnotation])
        .on("enter", enter)
        .on("out", out)
        .on("move", move);

    //draw the SVG
    var svg = d3
        .select("#graph")
        .append("svg")
        .attr("width", width + dimensions.left + dimensions.right)
        .attr("height", height + dimensions.top + dimensions.bottom)
        .append("g")
        .attr("transform", "translate(" + dimensions.left + "," + dimensions.top + ")");

    //draw the text
    var coordsText = svg
        .append("text")
        .style("text-anchor", "end")
        .attr("class", "coords")
        .attr("x", width - 5)
        .attr("y", 15);

    //setup data
    var accessor = candlestick.accessor();
    var data = graphData
        .map(function (d) {
            return {
                date: parseDate(d.date),
                open: +d.open,
                high: +d.high,
                low: +d.low,
                close: +d.close,
                volume: +d.volume
            };
        })
        .sort(function (a, b) {
            return d3.ascending(accessor.d(a), accessor.d(b));
        });

    //map data to x/y
    x.domain(data.map(accessor.d));
    y.domain(techan.scale.plot.ohlc(data, accessor).domain());

    //append candlestick
    svg
        .append("g")
        .datum(data)
        .attr("class", "candlestick")
        .call(candlestick);

    //append x top axis
    svg
        .append("g")
        .attr("class", "x axis")
        .call(xTopAxis);

    //append x bottom axis
    svg
        .append("g")
        .attr("class", "x axis")
        .attr("transform", "translate(0," + height + ")")
        .call(xAxis);

    //append y left axis
    svg
        .append("g")
        .attr("class", "y axis")
        .call(yAxis);

    //append y right axis
    svg
        .append("g")
        .attr("class", "y axis")
        .attr("transform", "translate(" + width + ",0)")
        .call(yRightAxis);

    //move function
    svg
        .append("g")
        .attr("class", "crosshair")
        .datum({ x: x.domain()[goToX], y: goToY })
        .call(crosshair)
        .each(move); // Display the current data

    //append text
    svg
        .append("text")
        .attr("x", 5)
        .attr("y", 15)
        .text(companyName);

    //mouse enter trigger for crosshair
    function enter() {
        coordsText.style("display", "inline");
    }

    //mouse out trigger for crosshair
    function out() {
        coordsText.style("display", "none");
    }

    //mouse move trigger for crosshair
    function move(coords) {
        coordsText.text(
            timeAnnotation.format()(coords.x) +
            ", " +
            ohlcAnnotation.format()(coords.y)
        );
    }
}

//export draw function
module.exports = {
    drawGraph: drawGraph
};
In short, I'm exposing a drawGraph function, which receives the data, company name, a custom width, and the default X/Y coordinates for the crosshair. The rest is just the techan example and pure d3.
Bringing the pieces together
First, you'll need the chart data. We're getting this by adding a new getGraphData method in the home component
  //gets chart data from the API
  getGraphData(result) {
    let gUrl = `https://api.iextrading.com/1.0/stock/${this.symbol}/chart/1m`;
    this.stock = result.data;

    this.$http
        .get(gUrl)
        .then(result => {
          this.graph = result.data;
        })
        .catch(this.handleErrors);
  },
You'll save the data in the graph property, which needs to be declared in the data function:
  data() {
    return {
      stock: {},
      graph: {},
      error: ""
    };
  }
It also needs to be initialized in the init function:
  init() {
    this.stock = {};
    this.graph = {};
    this.error = "";
  }
And now you'll call the getGraphData function right after the search method finishes:
   //search method, calls API
   search() {
      let url = `https://api.iextrading.com/1.0/stock/${this.symbol}/quote`;

      this.init();
      this.$http
        .get(url)
        .then(this.getGraphData)
        .catch(this.handleErrors);
    }
To send the data to the stock-quote component, you need to add the graph prop to where the component was included. This will be inside the template of your existing home component.
So the existing stock-quote declaration now becomes:
<stock-quote v-bind:stock="stock" v-bind:graph="graph"></stock-quote>Let's include the g-crosshair code to the stock-quote component's methods definition.
Add the following line just at the beginning of the script inside the stock-quote component.
let gCrosshair = require("../../lib/g-crosshair");Now, we need to add a new prop to receive the graph data. We'll also add a local width property in the data definition:
module.exports = {
  props: ["stock", "graph"],
  data() {
    return {
      width: 0
    };
  }
}
Next, we're adding some methods:
  methods: {
    //computes chart dimensions based on page width
    computeDimensions() {
      var graphEl = document.getElementById("graph");
      this.width = graphEl.offsetWidth;
    },
    //removes current chart
    cleanupGraph() {
      document.getElementById("graph").innerHTML = "";
    },
    //redraw the chart with new dimensions
    redrawGraph() {
      this.cleanupGraph();
      this.computeDimensions();
      var x = this.graph.length - 1;
      var y = this.graph[x].open;

      gCrosshair.drawGraph(
        this.graph,
        this.stock.companyName,
        this.width,
        x,
        y
      );
    }
  }
The computeDimensions method is needed to get the actual width of the chart placeholder. We'll call this whenever the chart needs to be displayed.
The next one, cleanupGraph just removes the existing chart to make room for a re-render.
And finally, redrawGraph cleans up, computes dimensions and calls the gCrosshair library.
And because we're going to be fancy about it, we'll add a data and resize watcher to make the chart responsive.
To do that, you'll need a watch on the graph property (triggers automatically whenever the chart data changes).
 watch: {
    graph() {
      //if the graph data is updated, rerender the graph
      if (this.graph.length) {
        this.redrawGraph();
      } else {
        this.cleanupGraph();
      }
    }
  }
For the window resize, we'll attach the redrawGraph method to the window resize event when the component is mounted, and remove it when it's destroyed.
  //run when component is mounted (add resize event)
  mounted() {
    window.addEventListener("resize", this.redrawGraph);
  },
  //run when component is destroyed (remove resize event)
  beforeDestroy() {
    window.removeEventListener("resize", this.redrawGraph);
  }
More styling
Now, let's adjust the styling a bit. Append these rules to the existing stock-quote component's style element:
.graph {
  font-size: 10px;
  margin-top: 50px;
}

path.candle {
  stroke: #000000;
}

path.candle.body {
  stroke-width: 0;
}

path.candle.up {
  fill: #00aa00;
  stroke: #00aa00;
}

path.candle.down {
  fill: #ff0000;
  stroke: #ff0000;
}

.crosshair {
  cursor: crosshair;
}

.crosshair path.wire {
  stroke: #dddddd;
  stroke-dasharray: 1, 1;
}

.crosshair .axisannotation path {
  fill: #dddddd;
}
That's it, your final stock-quote component should now look like below. I excluded some code to save some space. Here goes:
<template>
    ...
</template>
<script>
    //include g-crosshair code
    let gCrosshair = require("../../lib/g-crosshair");

    //export needed data
    module.exports = {
      props: ["stock", "graph"],
      data() {
        return {
          width: 0
        };
      },
      watch: {
        graph() {...}
      },
      mounted() {...},
      beforeDestroy() {...},
      methods: {
        computeDimensions() {...},
        cleanupGraph() {...},
        redrawGraph() {...}
      }
    };
</script>
<style>
    ...
</style>
The final result
Now we're ready to take this for a spin. Just run the following command and voila!
npm run-script buildAndRunWrapping up
Looking at what we learned above, you saw how Electron goes hand in hand with Vue.js and both are getting a lot of traction and support from the community on the web.
We also touched Bootstrap 4 a bit and made use of the limitless D3 library.
I personally like the component-based approach of Vue.js and the simplicity of Electron.
If you want to read more, I recommend the Vue.js guide, which helped me a lot while writing this article. If you're keen to dive deeper into Electron, I'd begin with this Quick start tutorial.
Before you go, don't forget to take a look at the source code.
That's it for now. Tomorrow will bring something new to learn.
 Building Performance First Angular Apps - Part 2
 Keeping up with ... web package versions
 JavaScript Episodes: Ep. 1 - The Mystery of the Callback